
How Growi shows an answer
Growi puts the answer in the text and adds a line chart whenever it read at least 4 points, also when you didn’t ask for one. A question about a current value reads the last 24 hours, so it usually comes with a chart. A chart you ask for is drawn however few points the period holds.
- Ask for the chart and name the measurement and the period: “Show me a chart of the greenhouse temperature over the last 7 days.”
- Name up to 6 measurements to get them in one chart. A chart holds at most 6 lines. A measurement without values in the period is left off the chart, and Growi names it in the text.
- Name two periods to lay them over each other: “Compare the greenhouse temperature of last week with the week before.” See Asking about your data.
- Select several crops and ask for one measurement to get a line per crop. See Choosing a crop.
Expected result
Section titled “Expected result”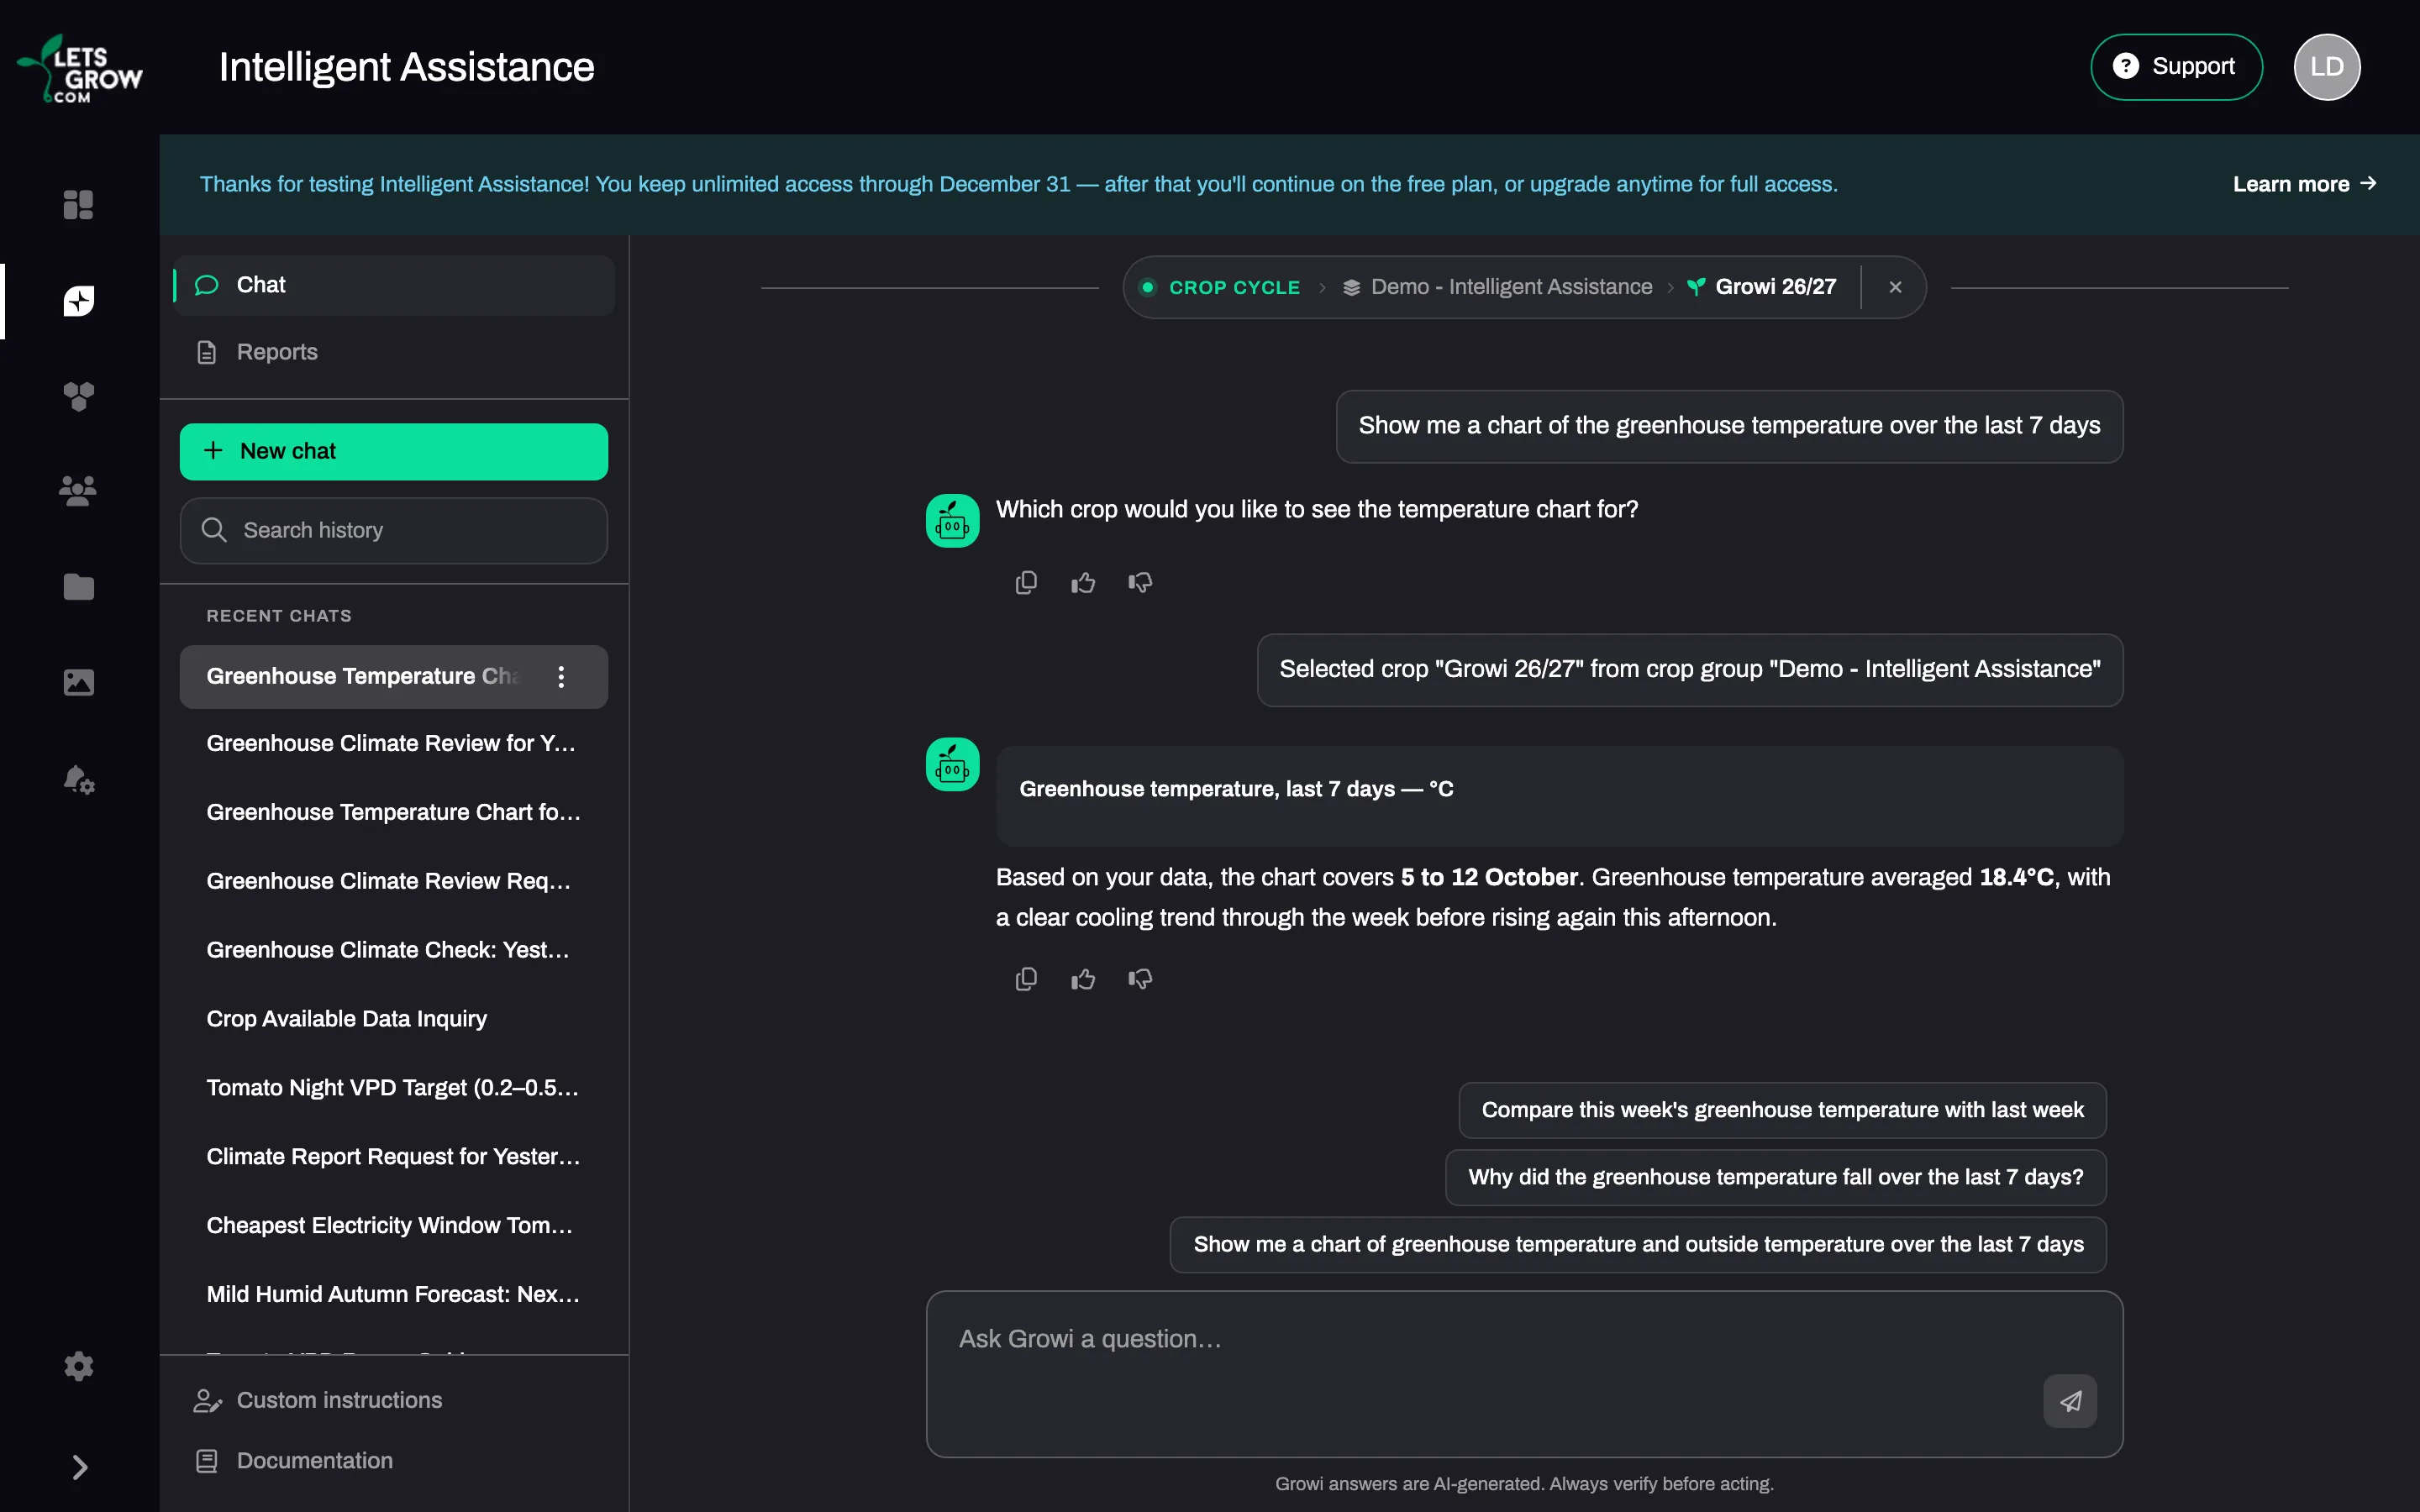
The shape of the answer follows the question.
| You ask | You get |
|---|---|
| One value | One or two sentences with the number in bold, plus a chart when there are at least 4 points |
| A yes or no question | Yes or No first, then at most two short sentences |
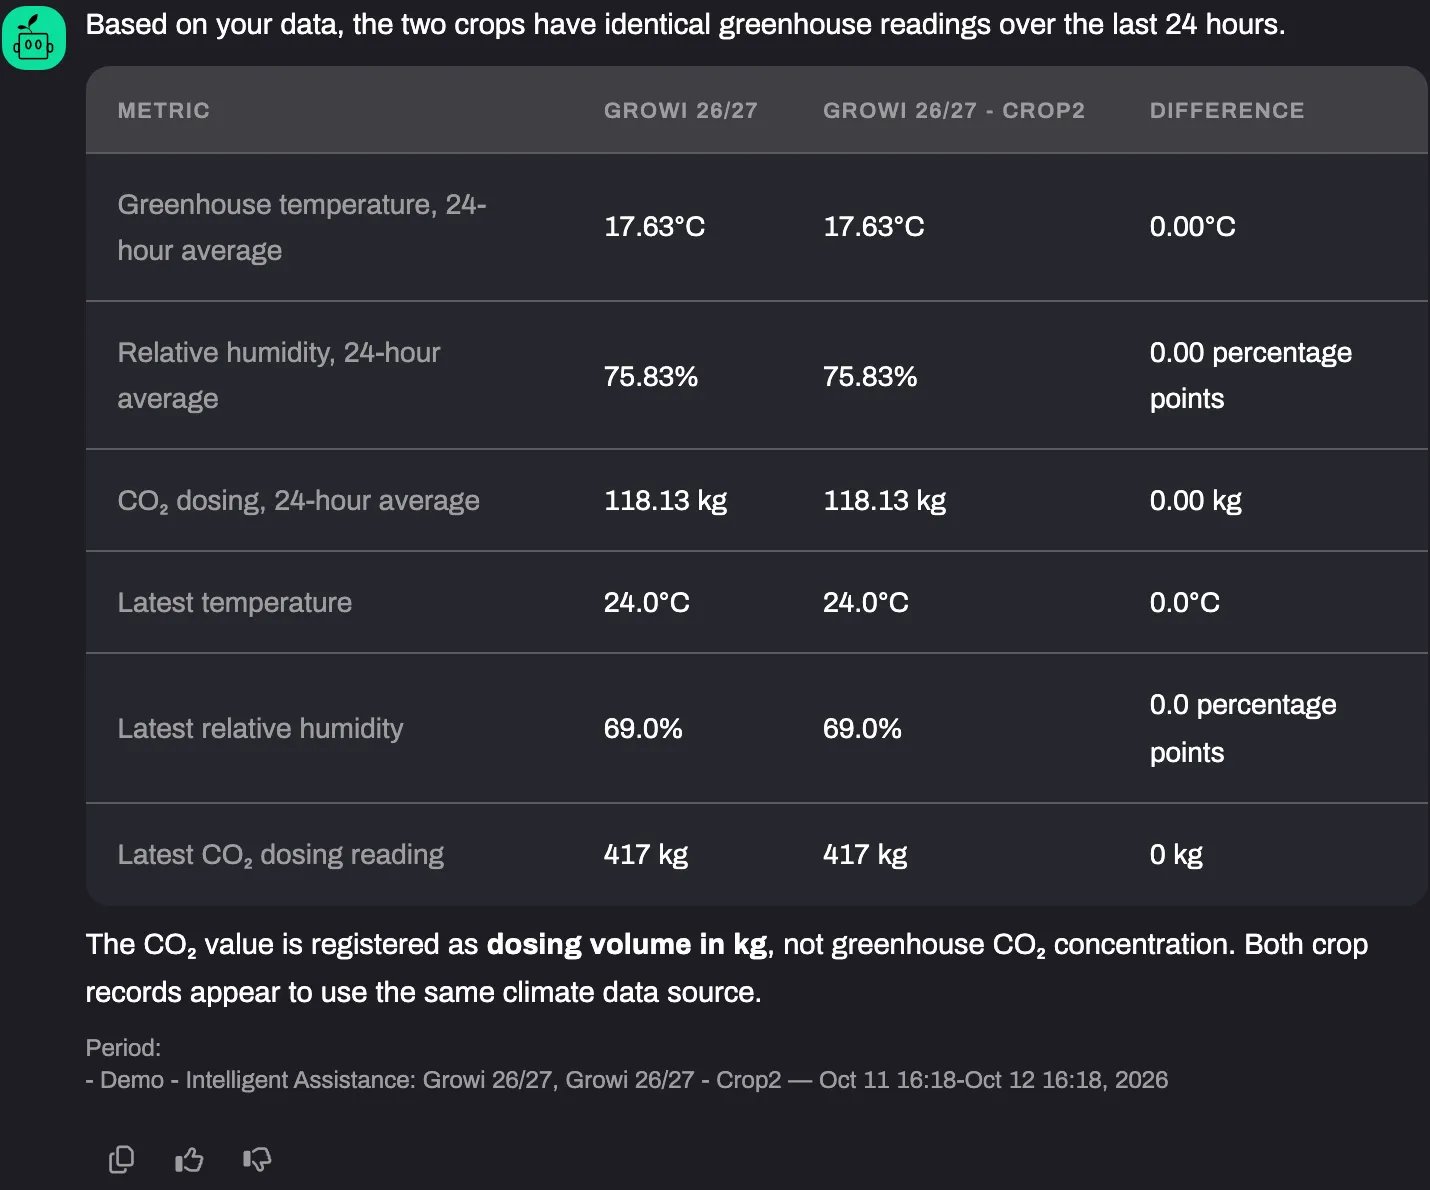
| Several values, or “how is the greenhouse doing?” | One sentence, a table and a closing line with the next step |
| One measurement across crops | One chart with a line per crop, or a small table when there are few points |
| Several measurements across crops | One table. Growi offers the chart as a follow-up |
| A series with fewer than 4 points | The values in the text or a small table, unless you asked for a chart |
In a status table Growi only judges a value when your own data holds a target for it. Without a target, the Target and Status cells show “-”. A row that has no value in any column is left out.
The text names the period the data covers, not the period you asked for: when 6 of the 7 days you asked about have values, Growi says 6 days. A highest or lowest value in the text comes with its date.
Under a table that compares crops, a footnote starts with “Period:” and names the crop group, the crops and the dates that were read for them, so you can see when the period differs per crop. A comparison chart has no footnote: the dates are on its axis.
When Growi cannot draw the chart you asked for, because the period holds no values, it says so and gives the values it has.
The period decides the detail of the chart.
| Period | Points on the chart |
|---|---|
| Up to 3 days | 5-minute values |
| More than 3 days, up to 7 days | One point per hour |
| More than 7 days | One point per day |
“Last week” gets hourly points. A line of 5-minute data carries only the name of the measurement in the legend, whatever the detail of the chart. A day, night or 24-hour value keeps that name, for example “(daily average)”, so two lines of the same measurement stay apart. The title of the chart follows the language you write in; the names of the lines are the names of your measurements in LetsGrow. The longest period for one chart is 5 years. Growi cuts a longer request to 5 years and tells you. For a forecast or a setpoint, a chart can reach 14 days ahead.
The weather forecast, energy prices and the IIVO ventilation analysis have a visual of their own. See Weather forecast, Energy prices and IIVO ventilation analysis.
Under an answer you find a thumbs up (Helpful), a thumbs down (Not helpful) and Copy, and up to 3 follow-up suggestions. Clicking a suggestion puts it in the input field. It is sent when you click Send.