
Asking Growi from a graph or dashboard
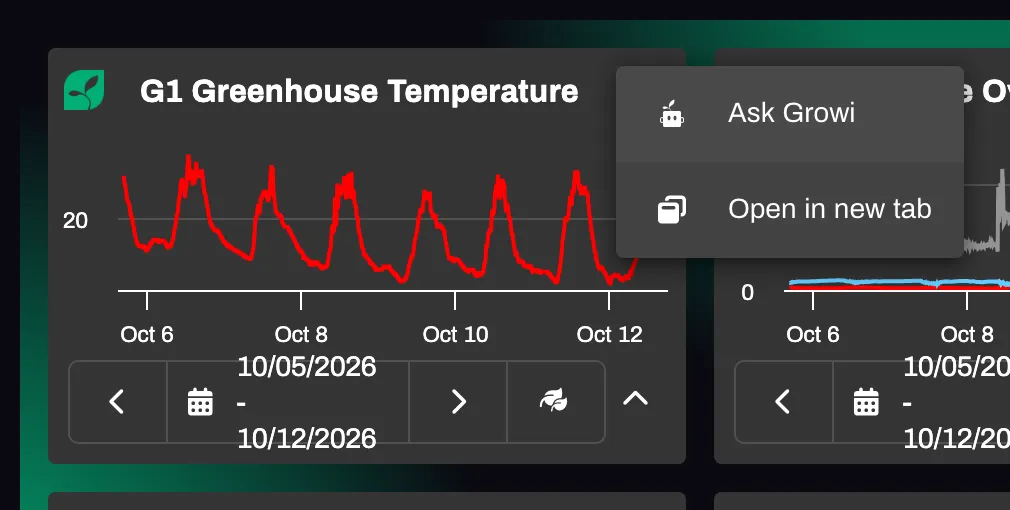
Open the menu of a graph tile on a dashboard and choose Ask Growi. The chat opens in a new browser tab with a message ready to send. Growi already knows the crop, the period and the lines of the graph.
Prerequisites
Section titled “Prerequisites”- The graph tile belongs to a crop group. Graphs of a module, climate or weather without a crop group have no Ask Growi, and neither have other tile types.
- Open the dashboard and open the menu of the graph tile.
- Choose Ask Growi, the first item of the menu. Intelligent Assistance opens in a new browser tab, so the dashboard stays as it was. When your browser blocks the new tab, the chat opens in the same tab.
- Read the message in the input field: “Analyze this graph for me”. Change it if you want to ask something else.
- Click Send. Nothing is sent before that.
Expected result
Section titled “Expected result”A new conversation without a crop card: the crop comes from the graph. Growi knows the name of the tile and the dashboard, the crop group and the crop (and the crop you compare with, if any), the period, whether the graph is grouped per week or per hour, and which lines it has and which of them are hidden. When you ask for a chart without naming measurements, Growi draws the visible lines of the graph, at most 6, over the same period and with the same grouping.
Growi answers about the period of the graph, also when that is a past week. A question without a period covers that period. Ask about “now” to get the current value, or “compare with last year” to set the same dates a year earlier against it. A follow-up that names a measurement on the graph, such as “and CO2 last week?”, uses that line of the graph, not another sensor with a similar name.
Above the chat a bar shows Chart, then the crop group, the dashboard and the tile. The icon at its right end opens the dashboard in a new tab. The cross hides the bar.

The conversation is saved in your history with the graph, and you can continue it later.